Intercepting and Logging Thread Creation
Sometimes, in order to throw off your efforts, Android apps will create a whole boatload of threads at a very high rate. Faced with random context switches and a generally unstable debugging environment as a result, it is always helpful to create a list of where all threads are initialized, and statically analyse them one at a time rather than attempt to do so all in one go. The most simple way to do so, is by latching onto a peculiar little system function called pthread_create.
int pthread_create(
      pthread_t *thread,
      const pthread_attr_t *attr,
      void *(*start_routine) (void *),
      void *arg);
thread: Location at which the ID of the thread is stored.
attr: Determines thread attributes.
start_routine: Invokes the function at the given position.
arg: Argument for the starting function.
Our most important items for this endeavor will be the third paramter, and the value of the LR register. Knowing the start_routine, we are able to immediately dissect what exactly the code of the thread is, and if it causes any harm to our efforts. The LR register, on the other hand, lets us see where exactly pthread_create was called from, and where the program will go next after completing it.
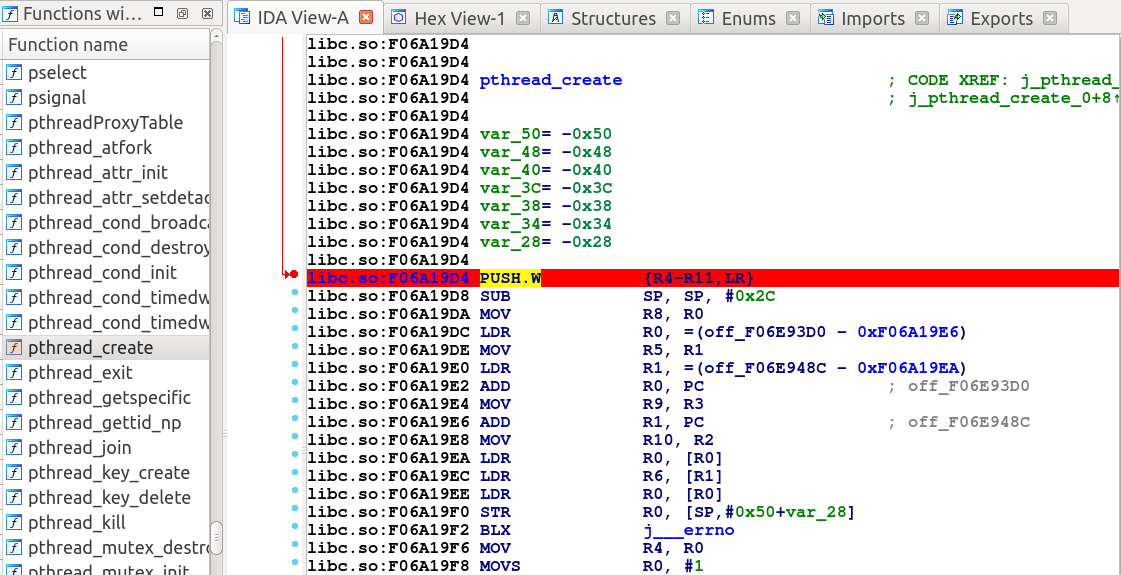
The first step, is to find the pthread_create function in the libc.so module.
After you have found and turned it into readable code, place a breakpoint on the first instruction.

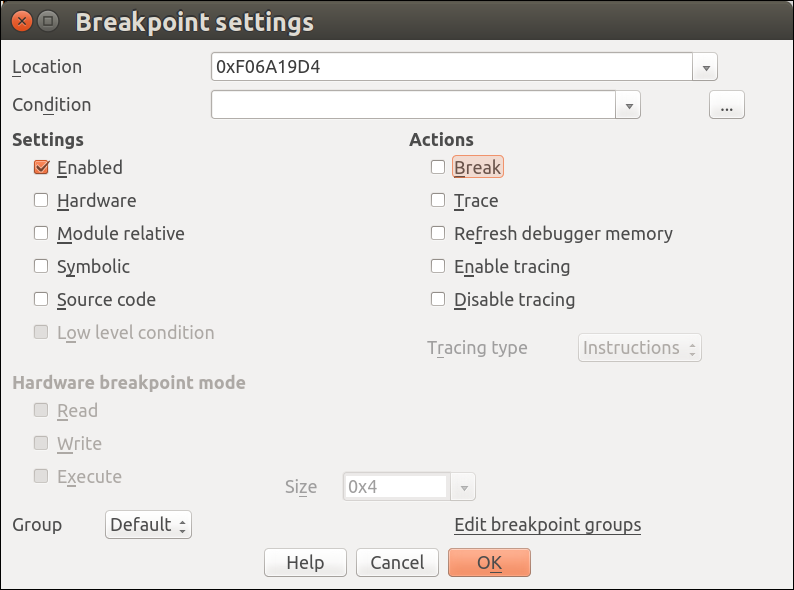
Now comes the most exciting part. Since manually going through the creation of each thread will be tedious, it is here that we will use IDA’s built in scripting language called IDC. Right click where you placed it, and hit Edit Breakpoint.

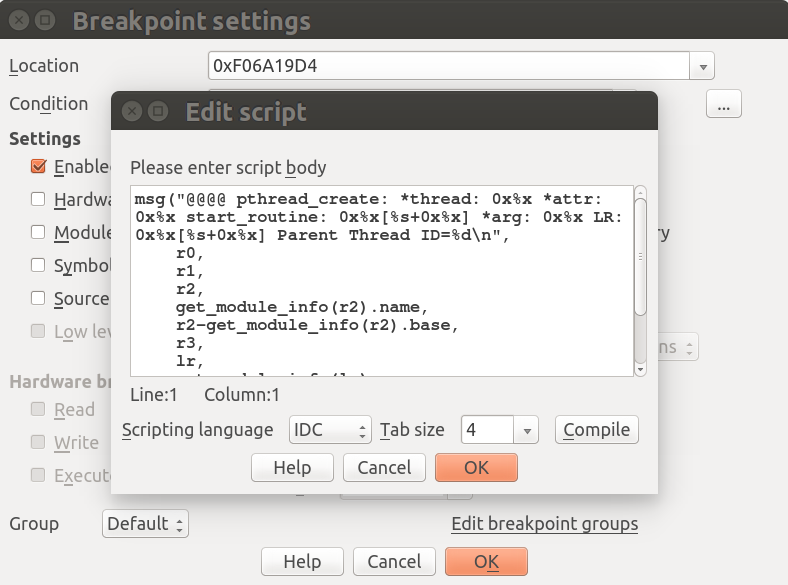
Uncheck Break, so IDA does not stop here, and click on the button with the 3 dots to the right of the Condition field. Enter the following script:
msg("@@@@ pthread_create: *thread: 0x%x *attr: 0x%x start_routine: 0x%x[%s+0x%x] *arg: 0x%x LR: 0x%x[%s+0x%x] Parent Thread ID: %d\n",
    r0,
    r1,
    r2,
    get_module_info(r2).name,
    r2-get_module_info(r2).base,
    r3,
    lr,
    get_module_info(lr).name,
    lr-get_module_info(lr).base,
    get_current_thread()),
0

Click compile to check that syntax is correct, click OK, and run the debugging session. In the console below, you should then see something similar to the following for each created thread (reformatted for clarity):
@@@@ pthread_create:
          *thread: 0xd0b61ea0
            *attr: 0x0
    start_routine: 0xd0b0d61c[/data/app/evil.app/lib/arm/evil_module.so+0x4361c]
            *args: 0x0
               LR: 0xd0acf710[/data/app/evil.app/lib/arm/evil_module.so+0x5710]
 Parent Thread ID: 18638
Now, you are able to see all the 4 parameters of the function, and the location (LR value) from which the thread was spawned. To help with identification, the script prints the name of the module corresponding with the address, and computes the offset from the base so you can locate it during static analysis.
